Who controls U.S. politics? An analysis of major political endorsements in U.S. midterm elections
DOI:
https://doi.org/10.58445/rars.38Keywords:
American Politics, Donald Trump, Bernie Sanders, Midterm Elections, Senate, House, Machine Learning, Statistics, Political Forecasting, Support Vector Machines, Logistic Regression, DBSCAN ClusteringAbstract
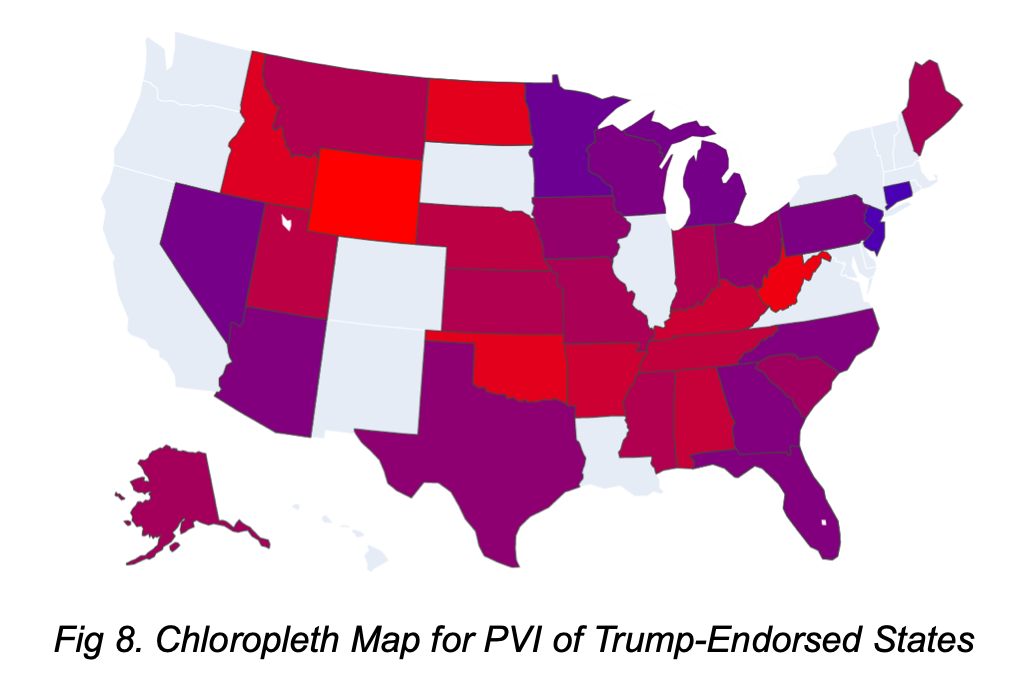
In this paper, we investigate the underlying patterns, rationales, and effects of major political endorsements in the United States midterm elections, specifically focusing on the endorsement patterns and impacts of two major politicians, Donald Trump and Bernie Sanders, in the 2018 and 2020 midterms. In order to uncover such patterns, we examine five demographic variables (Cook's PVI, Bachelor's attainment, percentage white, percentage aged 65 and above, and median income) as well as two candidate-specific variables (incumbency and progressivity, as quantified by percentage of votes in Congress in line with progressive left-wing positions). Though employing DBSCAN clustering and logistic regressions, we discover a dichotomy of pragmatic and ideological endorsements in U.S. politics, one perfectly exemplified by Trump and Sanders. Trump's endorsements are 97% predictable through a logistic regression on the five demographic variables alone, with PVI contributing the majority (55%) and education level contributing 28%; meanwhile, Sanders' endorsements are only 67% demographically predictable, but are 80% predictable through the progressivity of individual candidates alone. We therefore conclude a trend of Trump nearly exclusively endorsing in Republican-leaning states and basing his endorsements upon state demographics instead of individual candidates, and Sanders endorsing based on whether or not candidates align with a progressive ideology; we hypothesize that all political endorsements can be predicted by a combination of ideological and demographic factors, and fall somewhere along the dichotomy. Using a support vector machine model, we found that Trump's and Sanders' endorsements contributed 11% and 6% to election victories of their respective endorsed candidates, significantly behind factors such as PVI (38%), Bachelor's attainment (25%) and incumbency (14%), justifying trends such as Congressional stagnation, widening educational disparities in electorates, and political polarization. Finally, we predicted the results of the 2022 Senate elections using our model and forecasted a 67% chance for Democrats to retain the Senate.
References
Ballard, Andrew O., et al. “Be Careful What You Wish for: The Impacts of President Trump’s Midterm Endorsements.” Legislative Studies Quarterly, vol. 46, no. 2, 2020, pp. 459–491., https://doi.org/10.1111/lsq.12284.
Ballotpedia Editor. “Endorsements by Bernie Sanders.” Ballotpedia, 2 Sept. 2022, https://ballotpedia.org/Endorsements_by_Bernie_Sanders.
Ballotpedia Editor. “Endorsements by Donald Trump." Ballotpedia, 28 Sept. 2022, https://ballotpedia.org/Endorsements_by_Donald_Trump.
Cook Political Report. “Introducing the 2017 Cook Political Report Partisan Voter Index.” Cook Political
Report, 2017, https://www.cookpolitical.com/introducing-2017-cook-political-report-partisan-voter-index.
Cortes, Corinna, and Vladimir Vapnik. “Support-Vector Networks.” Machine Learning, vol. 20, no. 3, 1995, pp.
–297., https://doi.org/10.1007/bf00994018.
Lin, Hsuan-Tien, et al. “A Note on Platt’s Probabilistic Outputs for Support Vector Machines.” Machine
Learning, vol. 68, no. 3, 2007, pp. 267–276., https://doi.org/10.1007/s10994-007-5018-6.
Platt, John. “Probabilistic Outputs for Support Vector Machines and Comparisons to Regularized Likelihood Methods.” 26 Mar. 1999.
Ester, Martin, et al. “A Density-Based Algorithm for Discovering Clusters in Large Spatial Databases with Noise.” Association for the Advancement of Artificial Intelligence, 1996, pp. 226–231. 1., https://doi.org/10.5120/739-1038.
Sharma, Ankush, and Amit Sharma. “KNN-DBSCAN: Using K-Nearest Neighbor Information for Parameter-Free Density Based Clustering.” 2017 International Conference on Intelligent Computing, Instrumentation and Control Technologies (ICICICT), 2017, https://doi.org/10.1109/icicict1.2017.8342664.
US Census Bureau. “Profile.” Census Reporter: Making Census Data Easy to Use, https://censusreporter.org/.
US Census Bureau. “Voting Statistics: State Electorate Profiles.” Census.gov, 8 Oct. 2021, https://www.census.gov/library/visualizations/2016/comm/electorate-profiles.html.
Murse, Tom. “Do Members of Congress Ever Lose Re-Election?” ThoughtCo, ThoughtCo, 10 Dec. 2020, https://www.thoughtco.com/do-congressmen-ever-lose-re-election-3367511.

Downloads
Posted
Versions
- 2022-12-23 (6)
- 2022-12-23 (5)
- 2022-10-19 (4)
- 2022-10-19 (3)
- 2022-10-18 (2)
- 2022-10-18 (1)
Categories
License
Copyright (c) 2022 Research Archive of Rising Scholars

This work is licensed under a Creative Commons Attribution-NonCommercial-NoDerivatives 4.0 International License.

